San Martín, Peru
Peru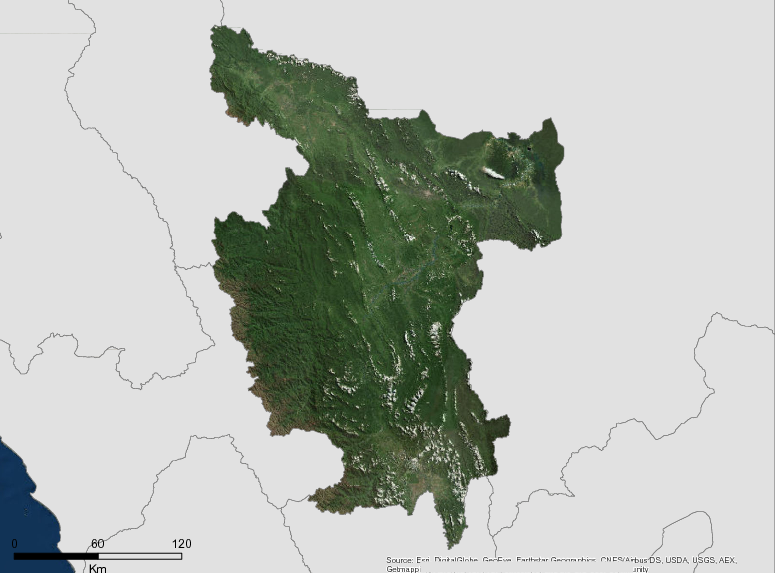
Description
Located in the northeastern part of Peru, the Region of San Martin has an area of 51,253 km², more than 60 percent of which is covered in forest. The San Martin region is actively engaged in jurisdictional partnerships to reduce deforestation including the Governors’ Climate and Forests (GCF) Task Force and the Under2Coalition. The region has also made ambitious commitments to reducing deforestation and combating climate change and has signed the Rio Branco Declaration and endorsed the Under2Mou.San Martin is a founding member of the Amazon Interregional Council (CIAM), and has signed the Declaration of Guadalajara that reaffirms the commitment of the Amazonian regions of Peru to reduce deforestation and move towards sustainable development for the implementation of the actions of the Joint Declaration (DCI) on REDD+ of Peru, Norway and Germany.
San Martin has moved from commitment to action with a set of measures and policies which promote managing forests in a sustainable manner, reducing deforestation, and implementing a territorial approach to rural development.The regional government is advancing a Production – Protection and Inclusion approach which seeks to stimulate public and private investment to improve the livelihoods of rural producers while reducing deforestation, land trafficking, wildlife trafficking and mitigating and adapting to climate change.
Additional information can be found on the GCF Impact Platform.
Summary
Demographics
Urban vs. Rural Population
| Category | % | |
|---|---|---|
| Urban | 65.00 | |
| Rural | 35.00 |
Ethnic Groups
| Group | % | |
|---|---|---|
| Lamas (Llacuash) | 16929 | |
| Aguaruna (Aguajun) | 3956 | |
| Chayahuita | 531 |
Economy
GDP Breakdown
| Category | % | |
|---|---|---|
| Other sectors | 31.60 | |
| Agriculture, Livestock, Hunting and Forestry | 26.40 | |
| Other service sectors | 23.30 | |
| Commerce | 12.00 | |
| Manufacturing | 9.70 |
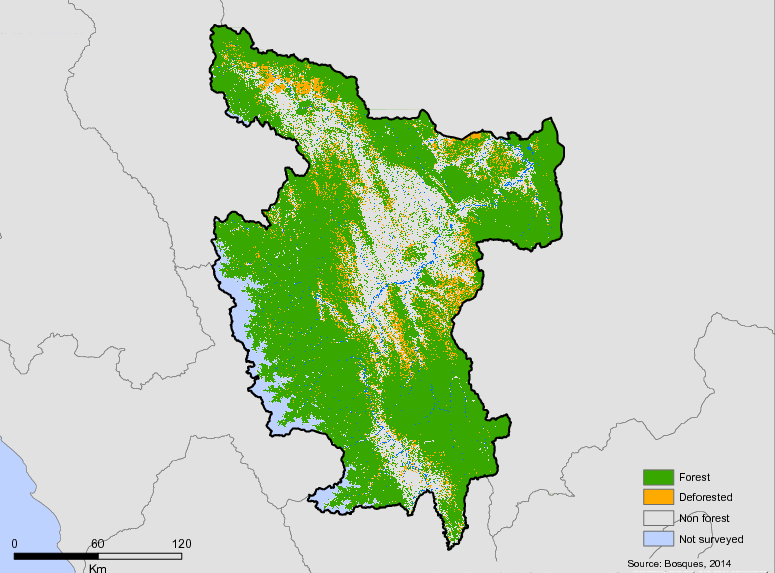
Forest Status
Major Vegetation Types
| Category | km² | |
|---|---|---|
| Humid Mountain Forest | 25,285 | |
| Intervening Areas | 14,132 | |
| Others | 6,554 | |
| Humid low hills Forests | 2,785 | |
| Dry scrub | 2,529 |
Forest Management
| Category | km² | |
|---|---|---|
| Without defined tenure or other types of tenure without available data | 16,484 | |
| National Protected Areas | 9,573 | |
| Concessions for conservation | 5,963 | |
| Other forest concessions | 4,815 | |
| Timber forest concessions | 2,713 | |
| Native titled communities | 2,160 | |
| Regional Conservation Areas | 1,499 | |
| Private Conservation Areas - ACP | 5 |
Drivers of Deforestation
There are no official studies on deforestation causes in the jurisdiction of San Martín. However, Conservation International (CI) in 2013, conducted a study called “Historical analysis of deforestation in the San Martin region.” This study names the most relevant causes of deforestation, and analyses drivers by geographic areas of San Martin.
In the case of the provinces of Moyobamba and Rioja, deforestation was due to “invasion, migration and leasing of lands of native communities”. In the provinces of Lamas and San Martín, primary drivers were identified as “internal migration, the promotion of alternative crops” and “road projects”. In Huallaga and Mariscal Cáceres, the study identified “forest concessions, migration, wood extraction, livestock activity, annual crops, cocoa crops” as causes of deforestation. And in Picota, land use change was found to be caused by “migratory advance for the development of agriculture towards the districts of Shamboyacu and Tres Unidos, the latter has the largest migratory flow in recent years”. These results, while preliminary in nature, came from participatory workshops complemented with a limited amount of Remote Sensing.
Deforestation Rates
Notes
| a. | Due to different methodological approaches and base years, Forest Status data fields may differ slightly. Data sources for each field are listed below. |
Sources
| 1. | (INEI, 2012) link |
| 2. | Instituto Nacional de Estadística e Informática, Estimaciones y Proyecciones de Población |
| 3. | (INEI, 2014) link |
| 4. | (BCRP, 2014) link |
| 5. | (PNUD, 2013) link |
| 6. | (PROMPERÚ, 2014) link |
| 7. | MINAM |
| 8. | Geobosques 2016 |
| 9. | |
| 10. | Elaboración propia basada en información de SERNANP (2018), SERFOR (2018) y COFOPRI (2006) *Considera concesiones forestales vigentes. **Datos del 2012. |
Overview of Forest Monitoring and Measurement Systems
The main source of periodic information on deforestation and land use change in the region comes from the national GeoBosques platform of the Ministry of the Environment. However, based on this platform, the Government of San Martin through the Regional Environmental Authority, reports deforestation (early warnings) to develop monitoring and control activities.
Reference Levels and Targets
Deforestation Rates
Sources
| 1. | Rio Branco Declaration based on national FREL |
| 2. |
Laws, Policies & Strategies
Strategies and Policies
Regional Environmental Policy: Approved by Regional Ordinance N °006-2018-GRSM / CR , approves the Regional Environmental Policy, which clearly sets out the principles and objectives of regional environmental management to which the economic, social, political and environmental development in the region will be aligned and which It is articulated with national environmental provisions and international commitments on climate change and biodiversity.
Plan of Regional Development San Martín – 2021 – The Agreed Regional Development Plan is a management tool for the development of San Martin. The plan outlines the aspiration of San Martin to achieve integrated and balanced development, with reduction of inequalities. The plan highlights and environmental priority of promoting the conservation and recovery of forest resources, and a vision of a region where natural resources are used sustainably, having controlled deforestation, and promoting the conservation and reforestation of forests; society as a whole contributes to an efficient management of environment, allowing preventive action and mitigating the effects of the climate change.
Regional Environmental Action Plan 2013-2021 – governance and planning tool across seven environmental sectors, including biodiversity, forests, and climate change. This plan is in the process of being updated.
Regional Strategy for Forest and Wildlife Control and Surveillance – approved through Regional Ordinance No. 004-2014-GRSM / CR, the Regional Forestry Strategy and Monitoring Control and Wildlife seeks to promote the Sustainable Management of Forest and Wildlife Resources participatory manner, implementing the Control and Surveillance Strategies.
Regional Aquaculture Plan – Through Regional Ordinance 024-2014-GRSM / CR, has a Regional Aquaculture Plan for the San Martín Region 2014-2023, which has six strategic objectives: develop and strengthen technical and business management services for regional aquaculture (SO1); Promote and strengthen the primary processing and commercialization of aquaculture products (SO2); Promote the development, adaptation and transfer of technologies in aquaculture at the regional level (SO3); promote regional production of inputs for aquaculture (SO4); encourage private investment in aquaculture (SO5); strengthen the organizational structure for an adequate management of regional aquaculture (SO6).
Strategic Plan for the Agricultural Sector of the San Martín Region – Through Regional Ordinance No. 023-2009- GRSM / CR., the Strategic Plan for the Agrarian Sector of the San Martín Region is declared a regional priority, constituting a multisectoral management tool to guide the policy of regional agricultural development, promoting economic, social and ecological sustainability.
Regional Forest Plan – Approved by Regional Ordinance 008-2008 / GRSM-CR, which establishes four components: program of management of productive forests, program of conservation and environmental services, reforestation and agroforestry and transversal actions.
Regional Biological Diversity Strategy of San Martín – Approved by Regional Ordinance 026-2007 / GRSM-GR. The Strategy seeks the following objectives: to ensure the conservation of biological diversity of the region, to reverse the processes of deterioration of diversity, to establish productive and competitive lines based on biological diversity, to develop a participatory management for the conservation and sustainable use of the biological diversity and consolidating the relationship between cultural and biological diversity.
Laws and Regulations
Regional Ordinance 21/2017 – Updates the Regulation of Organization and Functions (ROF) the regulation formalizes the creation of the regional environmental authority (ARA) and promulgates the regulation of the organization and functions.
For example, the structure and responsibility of the ARA is defined and highlights the authority of the ARA in the implementation of policies, strategies, programs and plans in the field of territorial planning, sustainable management of natural resources, conservation of biodiversity and the protection of the public environment.
Ordinance 17/2015 – Formalizing the regional development plan for 2020.
Decree 34/2014 – Declares of regional priority the implementation of the technological and institutional platform for the management of geospatial and cartographic information called Spatial Data Infrastructure and instructs the General Management of the Regional Government to authorize the Planning and Budget Management the prioritization and allocation of a budget line item to the Regional Environmental Authority,
Ordinance 30/2014 – Creates and Implements the Regional System of Compensation for Ecosystem Services (SIRRSE-SM), as a strategic component in the implementation of the Regional Territorial Policy of San Martín.Place authority of implementation and administration with the Regional Environmental Authority through the Executive Management of Territorial Management and the Executive Direction of Administration and Conservation of Natural Resources.
Ordinance 23/2014 – Declares of regional interest the measures related to the reduction of emissions from deforestation and degradation of forests and the environmental and social safeguards and creates the Regional Committee of Safeguards of San Martín, to guarantee the balanced participation of the actors in the identification, establishment and reporting of environmental and social safeguards for the reduction of emissions derived from
Decree 1/2014 – Approves the “Regulation of the Regional System of Environmental Information of San Martín – SIAR SAN MARTÍN”.
Decree 2/2014 – Establishes the process to obtain environmental certification of public investment projects prepared by the Regional Government of San Martin
Ordinance 22/2014 – Ordinance creating the Technical Group of the Regional Climate Change Strategy.The Climate Change Strategy for San Martin has not yet been approved.
Ordinance 16/2014 – Creates the Regional Environmental Information System of San Martin – SIAR – San Martin, as an environmental management instrument established in the Regional Environmental Management System,
Ordinance 11/2014 – Approve the update of the Regional Environmental Action Plan 2013-2021 in seventy two (72) pages, which contains the situational diagnosis, the vision of the region in environmental matters, the objectives, the priority goals to 2021, the strategic actions by goals prioritized and compliance with the Regional Territorial Policy and Concerted Development Plan of the department of San Martín.
Ordinance 37/2010 – Establishes the Regional Environmental Authority of the State of San Martín.
Ministerial Resolution 519 / 2009 – Transfers forest management functions for the regional government of San Martín.
Regional Decree 2/2009– Regional Decree approving the regulation for the application of the Ecological Economic Zoning – ZEE of the Department of San Martín
Institutional Framework
The Regional Environmental Authority of San Martín (ARA) – In 2010, the Government of San Martín created the Regional Environmental Authority (OR 037-2010-GRSM / CR). The Regulation of Organization and Functions (ROF) of the Regional Government promulgates the regulation of the organization and functions of the institution. Among the responsibilities delegated to the institution include: territorial planning, sustainable management of natural resources, and conservation of biodiversity and the protection of the environment. In total, the ARA has 24 delegated functions (OR No. 037-2010 – GRSM / CR). Currently, the ARA has 3 line agencies: Executive Directorate of Strategic Environmental Management, Executive Management of Territorial Management , Executive Direction of Administration and Conservation of Natural Resources .
Regional Management of Economic Development (GRDE) – Currently charged with overseeing the Regional Economic Development Plan, which is administered through four directorates: Regional Directorate of Agriculture, Regional Directorate of Production, Regional Directorate of Foreign Trade and Tourism, Regional Directorate of Energy and Mines.
Regional Directorate of Agriculture (DRASAM) – responsible for formulating, adapting, implementing, controlling and evaluating the public policies of the sector in matters of agricultural development in the regional scope. To this end, it is responsible for directing, executing, supervising, coordinating, managing and controlling the technical processes related to agricultural activity, in accordance with the corresponding powers of the Regional Government and the provisions established by the Regional Directorate for Economic Development. Among the roles that DRASAM must play in relation to forest landscape management are: the promotion of value chains, low-carbon agriculture and agroforestry systems.
Regional Directorate of Production (DIREPRO) –supervises and promotes investment projects and public financing associated with the productive sectors, small and micro-enterprises, fisheries and aquaculture in a sustainable and efficient manner, obtaining high quality products as a result.
Directorate of Foreign Trade and Tourism (DIRCETUR) – aims to encourage and increase demand as well as, facilitate mechanisms for the development of the sectors of tourism, handicrafts and external trade based on sustainable models.
Directorate of Regional Energy and Mines (DREM) – responsible for promoting and executing mining-energy projects that improve the quality of life in the region using models of sustainable development through public and private investment.
Office of Promotion of Sustainable Investments (OPIPS) – OPIPS is a body dependent on the General Management that is responsible for the facilitation of private investment in the region.Currently, its technical and economic resources are nascent, but it is envisioned that it can play an important role in promoting private investments for low-emission development.
Development Fund for the Amazon – FONDESAM San Martín – Funding mechanism that can allocate resources for the development of agricultural value chains of small producers.
San Martín Regional Environmental Commission (CAR-SM) – Regional Ordinance N ° 020-2012-GRSM / CR recognizes the Regional Environmental Commission of San Martin, as the entity in charge of coordinating and coordinating, within the framework of the Regional Territorial Policy, the environmental aspects, natural resources, territorial planning, as well as the environmental management system , promoting the dialogue between the public, private and organized civil society sectors in the department of San Martín. The recognition of the Regional Environmental Commission was ratified by OR-020-2012 GRSM / GR and its conformation is established, which is chaired by the Regional Environmental Authority.
REDD+ Roundtable of San Martín – Through Regional Executive Resolution N ° 864-2009- GRSM / PGR, the San Martin Regional REDD+ Roundtable was established as a space platform to achieve consensus on policy, legal, financial and social for the construction and application of the regional model to reduce deforestation.
Regional Committee of San Martin Safeguards – approved through Regional Management Resolution No. 001-2017-GRSM / ARA. The committee is comprised of the public sector, civil society, private sector, academia, and indigenous peoples.
Community Forestry Management Platform – Platofrm established to promote community forestry through Regional Ordinance N ° 014-2014-GRSM / CR,
Other important entities in San Martin for forest conservation are the Regional Directorate of Production (the regulator in the aquaculture sub-sector), the Research and Technology Centers (CITEs), and DIRETUR (responsible for exports and extra-regional trade).
Zoning & Spatial Planning
San Martin approved its regional economic and ecological zoning (ZEE) plan in in 2016, through Regional Ordinance Nº 012-2006-GRSM-CR. The zoning plan was completed at a scale of 1/250 000 and both the zoning study and map are available for download.
Engagement & Participation with Indigenous Peoples and Local Communities
The Regional Government of San Martin has implemented the Regional Office for the Development of the Indigenous Peoples, which was formed through Regional Ordinance 028-2005-GRSM-CR. The institutions develops its activities under the direction of the Regional Management of Social Development and is charged with formulating and executing projects aimed at indigenous communities in the region. According to the Institute of the Common Good in 2016, San Martín had 63 peasant communities, of which 2 are located in the province of Bellavista, 2 in El Dorado, 25 in Lamas, 1 in Moyobamba, 10 in Picota, 22 in San Martín and 1 in Tocache. Of these identified communities, 59 were pending recognition and ownership; In addition, a total of 1,264.40 hectares were registered. the Instituto de Bien Comun published in 2012 the “Directory of Native Communities in Peru” in which the San Martin region had 29 titled native communities that added an extension of 216,015.3288 titled hectares, 34 native communities registered by owner and 13 native communities to registered and titled, adding a total of 76 identified indigenous communities.
San Martin Developed a Regional Committee of Safeguards of San Martín through Ordinance 23/2014
Partnerships and Ongoing Initiatives
'La Marca' San Martin (the San Martin 'Brand')
- Description
-
La Marca San Martin promotes competitive differentiation for products and services of San Martin that meet the attributes defined by a Public – Private Committee to manage the brand (among private members are the Chamber of Commerce of Tocache, Palm Oil industry Loreto and San Martin SA and Rice Producers Association of San Martin). This initiative aims capitalize on sustainable supply chain initiatives and advances San Martin efforts to promote sustainability through a Production-Protection Approach.The Marca Currently has a committee comprised of both public and private sector representatives which is driving the initiatives and define the criteria and rules of use for using the trademark and logo.
- Partners
- NORAD, Mecanismos de Desarrollo Alternos, Earth Innovation Institute.
- Initiative Type
- Technical Assistance Partnership
- Initiative Status
- In Progress
Biocorredor Martin Sagrado – REDD +
- Description
-
The project enhances connectivity between Rio National Park Abiseo and the Alto Mayo Protected Forest, and is part of Conservation Corridor Abiseo Condor – Kukutú. The project involves legal registration, control and surveillance, non-timber economic activities, education and awareness, community empowerment and organizational strengthening, promotion and communication, international liaison and international certification. The project is in execution. It has been verified under the VCS.
- Partners
- Fundación Amazonia Viva, Acopagro, Pur Project
- Funding Source
- Fundación Amazonia Viva, Acopagro, Pur Project
- Funding Amount
- $80M to implement 295,654 hectares
- Initiative Type
- REDD+ project
- Initiative Status
- In Progress
Carbon Fund (proposed Program Document for Reducing emissions)
- Description
-
The Ministry of the Environment and the World Bank are designing a Program Document for the Reduction of Emissions (ERPD), which leads to payment for results as a result of the implementation of actions in the field and verification of the reduction of emissions that are estimated as a result of those actions. The Program is in the design stage. The scope is limited to the San Martín and Ucayali Regions.
- Partners
- Ministry of the Environment, Carbon Fund, world Bank
- Funding Amount
- Up to USD35,000,000 in potential purchases of reductions in the San Martin and Ucayali Regions. The final budget of the program will depend on the signing of the agreement for reducing emissions and obtaining them.
- Initiative Type
- Emission reduction program
- Initiative Status
- In ERPD design (emission reduction program document)
Cedisa- Agrobanco (Global Canopy)
- Description
-
Implement sustainable production patterns.
The intervention has the following objectives:
- develop innovative financing models to reduce or lessen the deforestation;
- guiding efforts towards sustainable production systems of regional impact;
- determine the costs of the transition from a traditional production scheme towards a model of sustainable production, and
- cash flow and the value of environmental services involved.
- Partners
- Global Canopy Program
- Initiative Type
- Finance Initiative
- Initiative Status
- In Progress
Conservation Concession High Huayabamba – REDD +
- Description
-
The project is located within the Conservation Concession Alto Huayabamba. The activities to prevent deforestation are: sustainable productive activities, education, and enhanced governance.The beneficiary families belong to the districts of Amazonas, La Libertad and San Martin. The project is seeking VCS and CCB validation.
- Partners
- AMPA Amazónicos por la Amazonia
- Initiative Type
- REDD+ project
- Initiative Status
- In Progress
Conservation Initiative Altomayo BPAM – REDD +
- Description
-
The project is investing in activities to improve the governance capacity of the Alto Mayo Natural Protected Area-NPA and buffer zone to address illegal activities and improve coordination between local communities and the administration of the protected area. Peruvian Society for Environmental Law (SPDA) acts as legal advisor of the project and the Association for Integrated Research and Development (AIDER) acts as technical advisor the project. Standards VCS and CBB were used. The project has been implemented and has already issued and sold carbon credits the international market.One of its main instruments of REDD+ project here is Conservation Agreements. It is an intervention model that creates an alliance between the local populations within the ANP with the Head of BPAM. Establishes concrete conservation actions who combine human activity and tend to ensure the functionality of the ecosystems of NPA. In return, volunteers subscribers of these agreements benefit from technical assistance and working capital, based on inputs and materials that generate sustainable business ventures, directly contributing to socioeconomic development of the Alto Mayo basin.
- Partners
- Conservation International
- Funding Source
- Conservation International
- Funding Amount
- $3.5M
- Initiative Type
- REDD+ Project
- Initiative Status
- In Progress
Forest Investment Program (FIP)
- Description
-
The overall objective of FIP is:
- support the efforts of developing countries in reducing emissions from deforestation and forest degradation;
- promoting sustainable forest management that lead to reduced emissions of greenhouse gases and preservation of carbon stocks.
In Ucayali the investment plan is under development for the province of Atalaya, and in San Martin for the Tarapoto – Turimaguas area. Both plans are expected to be finalized in 2017. Public investments will be used to support integrated forest landscape management, governance, legalization of lands, property titling and registration, environmental assets valuation.
- Partners
- Peruvian State Funds Investment Climate
- Funding Source
- Peruvian State Funds Investment Climate
- Funding Amount
- $50M
- Initiative Type
- Public investment, Technical Assistance Partnership
- Initiative Status
- In Design
Holistic Model Project with Long Term Vision – Secure Retirement
- Description
-
REDD + activities 5,500 hectares // 33 million trees.
This program comprises 03 reforestation projects with Acopagro, Oro Verde Fundacion Amazonia Viva (Corredor Martin Sagrado). These are projects that seek install agroforestry systems and forests mass. The first stage of the project has concluded.
- Partners
- FUNDAVI / Pur Project
- Initiative Type
- REDD+ project
- Initiative Status
- In Progress
Implementing Strategies for transition at regional level towards a low-emission rural development in Indonesia, Peru, Mexico, Colombia and Kenya
- Description
-
Development of policies and monitoring instruments for rural development plan for the Amazon.
This project seeks reduce emissions of greenhouse gases (GHG) emissions associated with deforestation and promote sustainable use of natural resources in the field of six regional governments in the Peruvian Amazon as contribution to mitigation and adaptation to climate change, biodiversity conservation, improved livelihoods of the local population and the development of practices regional, national and international policies and market mechanisms for rural development under emissions.The project will be implemented in two scales. At the interregional scalepolicies and monitoring instruments will be developed for rural development plans for the Amazon under a competitive, inclusive and low emission approach. The second scale is local and focuses on the basin of the Pachitea to develop a platform for low-emission rural development and strengthen capacities of local authorities and indigenous organizations. Work on the Pachitea is led by Instituto del Bien Comun – IBC. The project is expected achieve as first product the development of an Interregional Plan for promotion of a low emission development involving all participating regions. The project will also develop a platform for performance monitoring territorial performance as well as models of competitive and inclusive governance and incentives to reduce deforestation.
- Partners
- Regional Governments, Forest Trends, IBC
- Initiative Type
- Technical Assistance Partnership
- Initiative Status
- Under Implementation
Improvement and promotion of ecotourism in the tourist circuit Cueva de los Huacharos – Aguas Calientes Waterfall
- Description
-
The project is focused on the district of Soritor, Province of Moyobamba, Department of San Martín. It will benefit more than 210 people and aims to improve the access and tourist circuit of the Cueva de los Huacharos and the Aguas Calientes Waterfall in San Martín. Seeks to value the forest through tourism
- Partners
- Municipality of Soritor
- Funding Amount
- S / 942,890.63
- Initiative Type
- Project financed with a conglomerate of SERFOR-CAF projects and the executing agency’s own resources
- Initiative Status
- In implementation
Improvement of the environmental information service for the mapping of forest deforestation
- Description
-
The Project “Improvement of the environmental information service for the mapping of forest deforestation” is one of the four projects of the Forest Investment Program (FIP) approved for Peru. This Project seeks to strengthen the capacities of the Peruvian Government and key actors, such as indigenous peoples, to monitor deforestation. To this end, it proposes to articulate the georeferenced information systems, generate and distribute monitoring information, develop capacities to generate and distribute the information generated, the design of a community monitoring system as well as training and equipment for native communities. Specific activities for San Martín will be defined in 2019.
- Partners
- Ministry of the Environment, Ministry of Economy and Finance, Inter-American Development Bank
- Funding Amount
- S / 39,930,000 for the entire Peruvian Amazon. Total for San Martín not determined.
- Initiative Type
- Public investment project partially financed with resources from the CIF, operated by the IDB and deposited as a donation / loan to the Peruvian Government (60% donation / 40% loan in general for the entire program)
- Initiative Status
- At the start of execution (2018-2022)
Improvement of the service of sustainable use of the biodiversity of the ecosystems of forest landscapes of the Tarapoto-Yurimaguas corridor in the departments of San Martín and Loreto (FIP San Martín and Loreto)
- Description
-
The San Martín Loreto FIP is a project financed by the Forest Investment Program (FIP) and seeks to strengthen the institutional capacity for the conservation of the forest landscape, contribute to the proper allocation of land use rights, generate management tools for conservation of forests, promote the sustainable use of forests and their ecosystem services, strengthen technical, organizational, business and commercial capacities for sustainable businesses; besides promoting sustainable businesses for the conservation of forests. Specific activities for San Martin will be defined in 2019.
- Partners
- Ministry of the Environment, Ministry of Economy and Finance, Inter-American Development Bank
- Funding Amount
- S / 40,260.00. Total for San Martin not determined.
- Initiative Type
- CIF Grant operated by the IDB, as a donation / loan Govt. Peruvian (60% donation / 40% loan in general for the entire program)
- Initiative Status
- At the start of execution (period 2018-2022)
Joint Declaration of Intent between the Governments of Peru, Norway and Germany (DCI) "Cooperation for the reduction of emissions of greenhouse gases from deforestation and forest degradation (REDD +) and to promote sustainable development in Peru"
- Description
-
The Joint Declaration of Intent (DCI) is a voluntary cooperation agreement signed by the Governments of Peru, Norway and Germany to achieve the reduction of greenhouse gas emissions produced by deforestation and forest degradation in Peru. It was signed in September 2014 with a validity until 2020 and considers actions for the conservation of forests in the Peruvian Amazon.
The JIU is based on a scheme of financial incentives on the progress and / or fulfillment of deliverables or goals divided into three phases: preparatory phase, transformation phase and payment by results phase. The phases of the JIU are directly related to the strategic actions of the National Strategy on Forests and Climate Change (ENBCC) and different planning instruments for development in Peru, such as: a) the Bicentennial Plan: Peru by 2021, b) The National Environmental Action Plan (PLANAA), c) the Agreed Regional Development Plans of the Amazonian regions in Peru, d) the National Strategy on Climate Change, e) National Strategy on Biological Diversity and its Plan of Action, f ) the National Forestry and Wildlife Policy, among other instruments.
The Phase II Implementation Plan defines in more detail what activities will be carried out in the Amazon Region. This document can be hired at: http://www.minam.gob.pe/cambioclimatico/wp-content/uploads/sites/127/2018/06/Plan-de-Implementación-Fase-II-DCI.pdf
- Partners
- Government of Peru, Government of the Kingdom of Norway Government of the Federal Republic of Germany
- Funding Amount
- Investment made so far at the national level USD6.5 M. Potential for cooperation: Up to USD240 million subject to progress in the goals of each phase and payment for results.
- Initiative Type
- Trilateral agreement between governments at the national level.
- Initiative Status
- In execution (Phase I and II)
National Program of Agrarian Innovation (PNIA)
- Description
-
The PNIA is a national incentive program of the Ministry of Agriculture and Irrigation (MINAGRI) that seeks to contribute to the establishment and consolidation of a modern national system of science, technology and innovation for the development of the Peruvian agrarian sector, decentralized, plural, oriented by the demand, in association with the private sector; with the purpose of increasing profitability and improving the competitiveness of the sector, through the generation and adoption of sustainable and environmentally safe technologies. This Program is conducted by MINAGRI and allows the implementation of projects oriented to innovation and technology development, which are financed by competitions. In Ucayali, 6 projects have been financed: 4 for extension services, 1 for applied research and 1 for strategic research. In San Martin, at least 23 projects have been financed: 4 for adaptive research, 1 for competency-based training, 1 for seed companies, 3 for strategic research and 14 for extension. In Huánuco, 8 projects have been financed: 5 on extension services and 3 on seed companies. In Amazonas, 26 projects have been financed: 6 for strategic research, 3 for adaptive research, 11 for extension services, 11 for competency-based training, 2 seed companies, 1 for applied research and 1 for technology transfer. In Piura, 43 projects have been financed: 3 for strategic research, 6 for adaptive research, 30 for extension services, 1 for skills training, 1 for seed companies, and 2 for technology transfer. In Loreto, 6 projects have been financed: 1 for basic research, 3 for applied research and 2 for technology transfer.
- Partners
- Ministry of Agriculture and Irrigation, National Institute of Agrarian Innovation
- Funding Amount
- Not determined for individual jurisdictions
- Initiative Type
- Incentive program for agrarian innovation at the national level
- Initiative Status
- Under implementation
National UN-REDD Peru Program
- Description
-
The UN-REDD National Program seeks to strengthen the strategic framework necessary for the implementation of REDD + and the ENBCC. Thus, it is expected to improve regional governance for the implementation of the ENBCC, NDC and REDD +, provide national or regional public institutions with instruments that facilitate the implementation of ENBCC, REDD + and NDC, develop public and private investment projects for the implementation of the policy, programs and measures prioritized in the framework of the ENBCC, to elaborate a proposal of reference level of forest emissions that integrate emissions data due to forest degradation, in addition to achieving that the indigenous approach is integrated in the module of forest cover and other SNIFFS modules in Peru, as appropriate. Specific activities for Ucayali will be defined in 2019.
- Partners
- Ministry of the Environment, UNDP, UNEP, FAO
- Funding Amount
- USD 4,065,779
- Initiative Type
- Project implemented through the national implementation modality (component under UNDP) and direct implementation (UNEP and FAO components)
- Initiative Status
- At the start of execution. Period December 2017-May 2020
Phase 3 of the Forests, Farms and Finance Initiative
- Description
-
Phase 3 of the Forests, Farms and Finance Initiative “Building bridges between local policies, REDD + and initiatives for sustainable supply chains” will support the construction of jurisdictional low emissions rural development plans.
In Peru, the 3FI initiative is led by the Earth Innovation Institute and the Amazon Regional Council (CIAM, in Spanish) and is developing incentives for low-emission rural development under a production and protection approach. The activities of 3FI in the Peruvian Amazon are led by the regional governments and are open to the participation of any public or private institution that wishes to contribute. 3FI considers with special attention the participation of indigenous peoples and women in the activities to be carried out. The initiative is based on empowering the progress of each region to make the necessary incentives proposals by building tailored instruments for each jurisdiction. Output from the project include: (a) developing regional plans or roadmaps to promote a transition to low-emission rural development; (b) promoting a transparent dialogue process at the regional level which includes the perspectives of indigenous peoples and women; and (c) developing a business plan to attract private investment and promote low-emission rural development in the Peruvian Amazon.
- Partners
- Earth Innovation Institute, CIAM
- Initiative Type
- Technical Assistance Partnership
- Initiative Status
- Under Implementation
Phase II of the Support to the Implementation of the National Strategy for the Reduction of Emissions for Avoided Deforestation and Forest Degradation in Peru "(RPP-2)
- Description
-
The RRP-2 Project 1.1. seeks to create the necessary conditions for the preparation and implementation stage of REDD + in Peru. This Project will consider strengthening spaces for citizen participation, such as the REDD + Indigenous Tables, the design of a grievance mechanism, implementing the PPIA, strengthening regional governments to implement the NDC and the ENBCC, and conducting studies for the effectiveness of strategies and land use planning instruments, contribute to the implementation of the national REDD registry, design benefit sharing mechanisms, improve the forest monitoring platform, update the forest reference level, design early response protocols to the monitoring reports of forests and implement a pilot of the Safeguards Information System. Specific activities for Amazonas will be defined in 2019.
- Partners
- Ministry of the Environment, FCPF, Ministry of Economy and Finance, Inter-American Development Bank
- Funding Amount
- USD 5,000,000.00 for all of Peru. Total for Amazonas not determined.
- Initiative Type
- Project that enters as a donation from the FCPF to the Peruvian Government through the IDB. Executed by MINAM (PNCB Executing Unit)
- Initiative Status
- At the start of execution
Preparing the way for the implementation of the Transformation Phase of the Joint Statement of Intent signed by the Governments of the Republic of Peru, the Kingdom of Norway and the Federal Republic of Germany
- Description
-
This project is considered as the first disbursement by the Norwegian Government to the Peruvian Government associated with the DCI. It considers four components or results: 1) the Government of Peru has planned the implementation of Phase II of the JIU and has begun its execution efficiently, 2) the zoning and forest management in the San Martin and Ucayali regions has increased, 3 ) value of the increased forest in order to be more competitive against the activities that cause deforestation and forest degradation, and 4) control of illegal activities that cause deforestation and forest degradation has increased. The activities of this Project in San Martin included the participation of the Regional Government of San Martin and Indigenous Peoples in the design of the Implementation Plan for Phase II of the JIU, the titling of native communities, strengthening the forest zoning process, promoting the conformation of the regional forestry control and monitoring table, in addition to increasing the coverage of conditional direct transfers for the conservation of forests in favor of native communities.
- Partners
- Ministry of the Environment, UNDP
- Funding Amount
- USD 6,135,722. Total executed in San Martin not specified.
- Initiative Type
- Project executed through UNDP under the modality of national implementation
- Initiative Status
- In execution Period: June 2016-August 2018
Production-Protection Approach in the Value Chains of the Peruvian Amazon
- Description
-
The aim is to increase the productivity and the conservation of the forests in small producers of value chains of cocoa and coffee.
Activities that are likely to be implemented include:
- Evaluation of the current value chain
- Interventions to add value to supply chain (production and postproduction centered on coffee and cocoa)
- Development of multi-stakeholder platforms to improve supply chain sustainability
- Improving production capacity at the farm level, and
- Development of business models and enabling policies
- Partners
- Norway Institute for Bioeconomy Research, Instituto de Cultivos Tropicales, Mecanismos de Desarrollo Alternos
- Funding Amount
- US$ 3.2 M four-year project
- Initiative Type
- Technical Assistance Partnership
- Initiative Status
- In Design
Public-Private Coalition of the Declaration of San Martin
- Description
-
This Coalition of 52 member organizations from government, private sector and civil society seeks to promote sustainable rural development and create synergies between regional governments, the private business sector, producer organizations, NGOs and organizations representing indigenous peoples. The coalition has established an agenda to promote development amazon focused on: i) ensuring land rights and forest native communities and agricultural and forestry producers; ii) optimizing the sustainable use of forest landscapes in the Amazon; iii) building the set of enabling conditions and generate the necessary changes for rural development low emission. Goals of the coalition include reducing deforestation associated with agriculture, creating roadmaps for public – private coordination by Amazon region, designing an architecture of financing, increasing the productivity of agricultural crops and increasing the value of forests and promote forest plantations. It is expected that these measures will open a pathway to build sustainable jurisdictions, especially in the value chains of the Amazon through a Production – Protection approach. A group of companies from the Pro Ucayali network, comprising the largest companies in the region, have joined the coalition.
- Partners
- GORE San Martin, GORE Ucayali, GORE Amazonas, GORE Madre de Dios, GORE Huanuco
- Initiative Type
- Public Private Partnership
- Initiative Status
- Agreement Signed
Recovery of the marginal belt of the Shima River micro-basin through the use of bamboo in communities of Huallaga, San Martín
- Description
-
The Project is focused on the district of Saposoa, the Province of Huallaga in the Department of San Martín. The project will benefit more than 950 people and aims to recover 120 hectares of eroded areas from the marginal belt of the Shima river microbasin. For this purpose, the vegetation in the marginal strip will be replaced, technology will be transferred to the local communities on bamboo management and technical assistance will be given for the exploitation and commercialization of this species.
- Partners
- Provincial Municipality of Huallaga
- Funding Amount
- S / 1,109,007.26
- Initiative Type
- Project financed with a conglomerate of SERFOR-CAF projects and the executing agency’s own resources
- Initiative Status
- In implementation
REDD + ANP Cordillera Azul
- Description
-
REDD + activities by 1.3 million hectares of the Cordillera Azul National.
The project includes infrastructure management, establishment of viable protected areas, stabilization of land use and tenure in the buffer zone, working with communities and local officials and coordination with the regional and national governments to design development strategies that are compatible with the biodiversity of the Natural Protected Area. The project has received funding from various sources including the Field Museum, United States Agency for International Development (USAID), the Gordon and Betty Moore Foundation, the MacArthur Foundation, the Foundation Exelon Frankel Family Foundation and the Spanish Agency for International Cooperation (AECID).VCS and CCB standards were used.
- Partners
- CIMA Park
- Initiative Type
- REDD+ project
- Initiative Status
- In Progress
Saweto Dedicated Grant Mechanism – Peru
- Description
-
Support Indigenous Peoples in the Peruvian Amazon in their efforts to establish the enabling conditions for sustainable forest management practices. Project Components:
Component 1 – Native Land Titling
Component 2 – Indigenous Forestry Management
Component 3 – Project Management, Monitoring and Evaluation
- Partners
- AIDESEP, CONAP, WWF
- Funding Amount
- US$5.5 million
- Initiative Type
- Iniciativa de Pueblas Indigenas
- Initiative Status
- Under implementation
Support for the implementation of the Joint Declaration of Intent on REDD + between Peru, Norway and Germany (WWF-DCI)
- Description
-
The WWF-DCI Project was executed during the 2015-2016 period and sought to contribute to the early implementation of the DCI. The Project considered five components or expected results: a) result 1. the Government of Peru, civil society and indigenous peoples increase their commitment to the implementation of Phase 2 of the JIU, 2) result 2. agrarian policies and instruments of regional development are improved and incorporate the approach of low carbon agriculture and production, protection and inclusion in San Martin and Ucayali, 3) result 3. Deforestation in two regions of the Peruvian Amazon (San Martin and Ucayali is monitored, 4) result 4. land tenure of improved native communities, and 5) result 5. improvement of forest protection in territorial reserves. Activities for the Amazon Region included the participation of the Regional Government of Amazonas in the design of the Implementation Plan for Phase II of the JIU.
- Partners
- Ministry of the Environment, Regional Government of Loreto, WWF, AIDESEP, CONAP, Forest Trends, Earth Innovation Institute, Alternate Development Mechanisms
- Funding Amount
- NOK 47,500,000. Total executed in Amazonas not specified.
- Initiative Type
- Project executed through WWF under the leadership of MINAM, MINCU, GORELO, WWF, Forest Trends, Earth Innovation Institute, Alternate Development Mechanisms
- Initiative Status
- Completed Period: 2015-2016
Support the implementation of the DCI-UNDP
- Description
-
In the case of Ucayali and San Martin this project seeks to implement forest zoning by providing technical personnel, equipment and funding processes for zoning and titling in coordination with the Regional Environmental Authority and the Regional Agrarian Authority. To date, it has been advancing on Module I of the Forest Zoning. The project also supports the titling of areas of native communities (seeking recognition, titling and expansion of 53 native communities). The project will conclude in November 2017.
- Partners
- United Nations Development Program; MINAGRI – Dirección General de Asuntos Ambientales Agrarios Gobierno; Reional Governments of San Martin and Ucayali
- Funding Source
- UNDP
- Funding Amount
- $6M
- Initiative Type
- Technical Assistance Partnership, Indigenous Peoples Initiative
- Initiative Status
- Under Implementation
Sustainable Forestry Development Program, inclusive and competitive – SERFOR – CAF
- Description
-
This project supports regions in strengthening their management capacity and monitoring in forestry, with their equipment offices and checkpoints. The project also has specific activities with regional governments and the management of protected areas, forest land, advancing the national forest inventory, implementation of spatial data infrastructures, implementation of anticorruption plan in the forestry sector, improved control and forest monitoring and promotion of forestry value chains. The project also has a grant fund for submitting public investment projects at regional level.
- Partners
- National forest and Wildlife Service, Andean Development Corporation, regional governments
- Funding Source
- National forest and Wildlife Service, Andean Development Corporation, regional governments
- Funding Amount
- $76M
- Initiative Type
- Technical Assistance Partnership, Public Investment
- Initiative Status
- Under Implementation